グラフを示して傾向と例外を口頭で説明する
何の記録を示す図かを伝え、始めと終わりだけでなく、途中の低下・横ばい・最大値にも注意します。例外がない図に例外を作らず、測定していない期間や原因へ広げません。
学年・内容の目安 高校の発表の一部を参考(既習語句と図の支援を調整)。授業の復習や教材の準備に使えます。公開教材の利用条件を確認し、年少の生徒には講師が紙の教材を用意します。
学習内容や既習事項に合わせて使う独自の練習です。文部科学省の認定教材や、教科書・入試の全範囲を網羅する教材ではありません。
文部科学省の高校外国語編の冊子50〜51(PDF60〜61)の、語句・構成の支援や図表を用い、根拠とともに聞き手へ話して伝える活動の一部を土台にした独自教材です。British Councilの図の対象・全体像・重要な変化を整理する助言も参考にしていますが、同資料は書く活動です。ここでは実際の口頭説明を講師が観察し、高校科目全体・試験・CEFRの到達を認定しません。
解説を読む
14の選択問題で、オリジナルのグラフの期間・単位・全体の動きと途中の変化を確かめ、6つの口頭課題で聞き手に図を示して英語で説明します。全て教材内の架空の記録で、実際の調査結果ではありません。
必要な予備知識
This graph shows ...、It rose from ... to ...、It fell ...、It stayed at ...、However ...などを別の図で確かめます。軸の単位と観測時点を読み、必要な語句・キーワードのメモ・言い直し・支援を使えます。
- まず図が何の記録か、どの期間・時点と単位を示すかを聞き手に伝えます。図を拡大したり代替テキストで数値を確かめたりできます。
- 始めと終わりの全体の変化と、途中の各区間の変化を区別します。最後が最初より大きくても、毎回増えたとは限りません。
- 全体の動きに合わない低下・上昇や横ばいがあれば、位置や数値を根拠に説明します。全ての点を順に読み上げることは必須ではありません。
- 最大値が最後とは限りません。始めと終わりが同じでも、途中に変化があるかを確かめます。
- 全て同じ値なら、この観測時点では同じだと伝えます。必ず例外を一つ作ることを条件にしません。
- 図にない原因・気持ち・人気や成果を作りません。観測していない時点の値や将来の変化、全ての人への結論へ広げません。
- 口頭課題では指定の図を聞き手と共有し、図に対応する箇所を示したり言葉で特定したりしながら、一方向の発表をします。生徒の実際の記録や調査、スライド作成、質問応答・役交代は必須ではありません。
- 講師は解答例を隠し、実際の英語の説明を観察します。語句やメモ・支援を認めます。選択や数値の筆記だけ、例の全文暗唱だけでは口頭達成とせず、語数・秒数・視線・アクセント・録音を条件にせず、自動採点しません。
解き方の例
例えば、別の三時点が2、5、4なら、始めと終わりでは増加していますが、最後の区間では低下しています。It rose overall, but fell from the second point to the third.などと範囲を明確にします。
The last value is higher.という比較と、It rose at every step.という全区間の主張を区別します。
よくある間違い
- 期間・時点や単位を示さず数字だけを読む。
- 始めと終わりが増えているので毎回増加とする。
- 横ばいを上昇と言い、途中の低下や最大値を見落とす。
- 同じ終点だけを見て、途中にも変化がなかったとする。
- 例外のない図に低下などを作る。
- 図から未提示の原因・人気・学習効果・将来の数値を断定する。
記述・対話・実習を講師と確かめる
講師が、生徒が指定のグラフを聞き手と共有し、図の対象・期間や観測時点・単位を英語で示し、必要な数値や位置を根拠に全体の動きと途中の特徴をまとまりよく説明することを観察します。低下・横ばい・最大値など、全体の単純化を防ぐ特徴があれば伝え、観測値が全て同じなら例外を作らずその範囲を説明します。図にない原因・人気・効果・将来の変化は加えません。全点の読み上げ・同じ接続詞・語数・秒数・視線・録音を必須にせず、語句・メモ・言い直し・支援と自然な別表現を認めて記録します。図の読み取りや選択・筆記・例の全文暗唱だけを実際の口頭説明の達成とはせず、自動採点しません。
全て教材内の架空の記録と図です。実際のクラブ・訪問者・生徒の調査や学習成果ではありません。講師用の模擬発表例を実際の生徒の発話として扱いません。
文部科学省の高校外国語編 · British Council: Describing charts
読む文章・資料
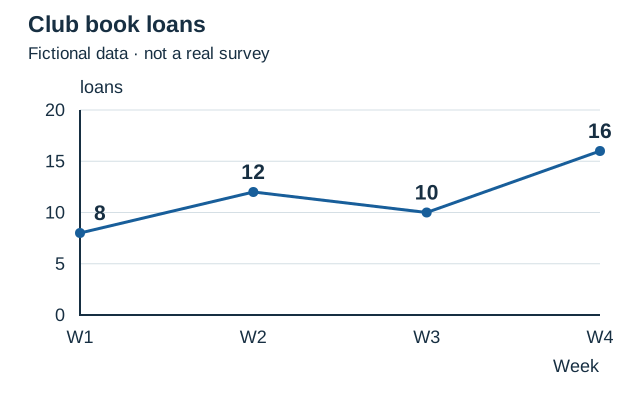
四週間の貸出記録:全体と途中の低下
Fictional graph 1 records the number of book loans in each of four weeks, W1 to W4, at a club corner. The unit is loan transactions, not unique people. The labelled points are joined to help show their order.
Use the recorded points to explain the overall change and any interval that differs from a simple upward pattern. No reason for the changes, reading ability, or value between the recorded points is supplied.
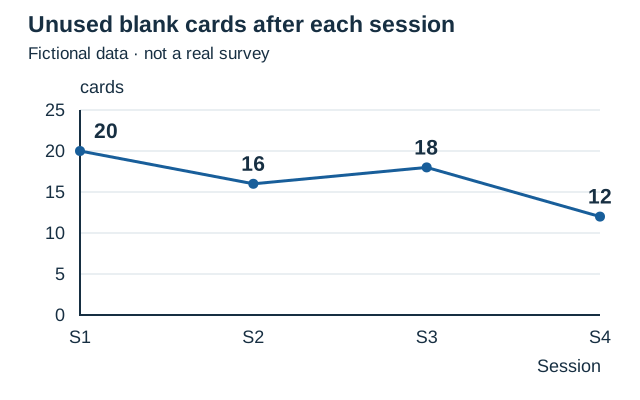
残った無地カード:全体の減少と増加した区間
Fictional graph 2 shows unused blank cards counted after four club sessions, S1 to S4. The unit is cards. Each point is the count after that session; it is not a count of people.
Explain the change from the first count to the last and check the intervening counts. No explanation of why cards remained, how they were used, or whether the activity was successful is supplied.
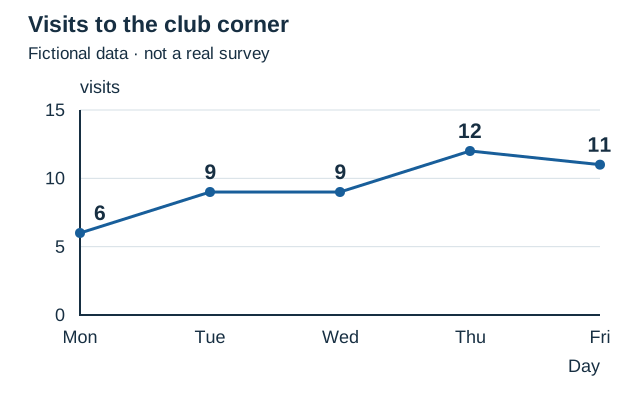
五日間の来訪:横ばいと最後の低下
Fictional graph 3 counts visits to a club corner from Monday to Friday. The unit is visits, not distinct visitors. A person could make more than one visit; the graph gives no individual records.
Explain the overall direction using the first and last days, and check whether every daily step increases. No popularity measure, reason for visiting, or later-week prediction is supplied.
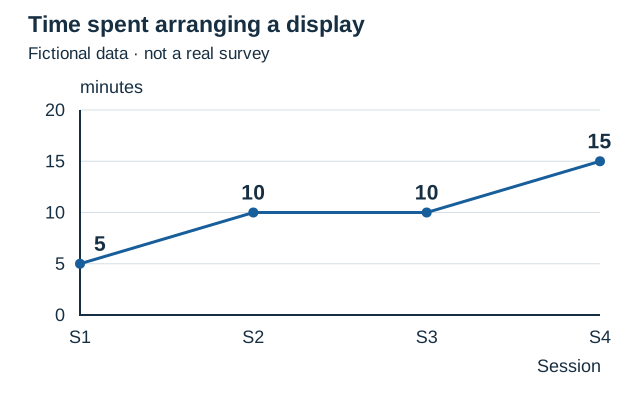
配置にかかった時間:増加と途中の横ばい
Fictional graph 4 records minutes spent arranging a display in four sessions, S1 to S4. It describes recorded time spent on this job, not a speed score or a measure of how good the display was.
Explain the first-to-last change and an interval with no change. The graph does not supply the cause of the time differences, the quality of the work, or the amount of work completed.
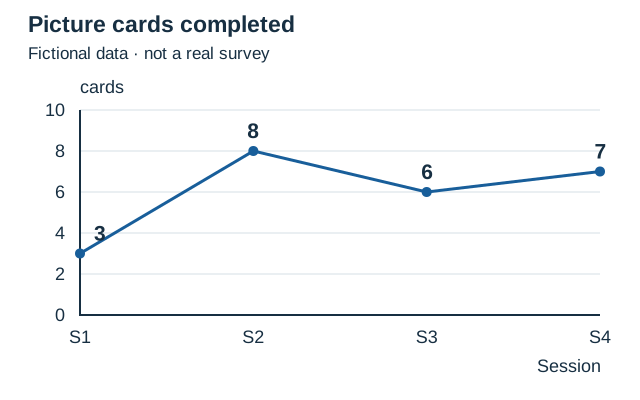
完成したカード:最後の値と最大値を分ける
Fictional graph 5 counts picture cards completed in each of four club sessions, S1 to S4. The unit is cards completed in that session, not a cumulative total across sessions.
Explain the first-to-last change and locate the largest recorded count. No cause, card quality, member ability, or prediction about the next session is supplied.
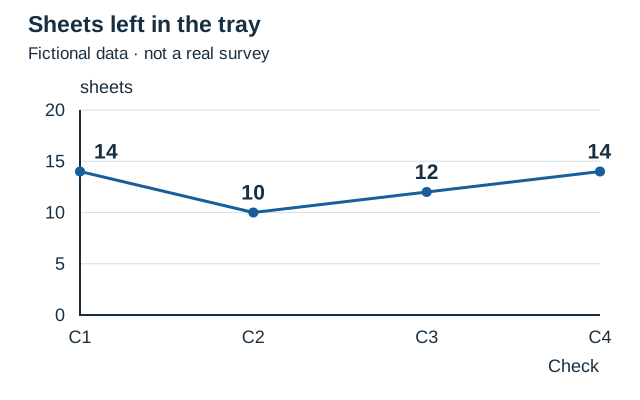
トレーの用紙:同じ両端と途中の動き
Fictional graph 6 counts sheets left in a tray at four successive checks, C1 to C4. The unit is sheets at a check. The time between checks and the reasons for the changes are not supplied.
Explain both the first and last recorded counts and the pattern in between. Equal first and last values do not by themselves mean that all recorded values are equal.
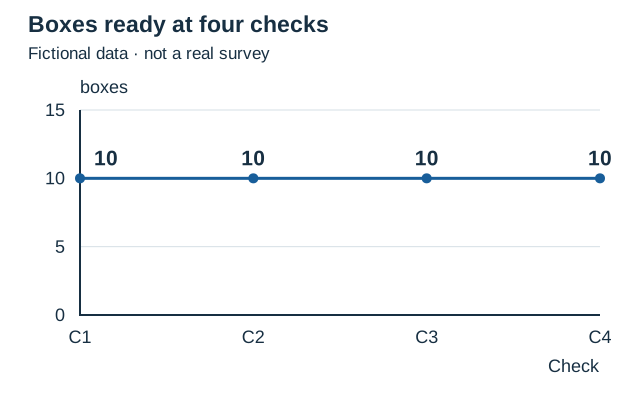
四回とも同じ値:例外を作らない
Fictional graph 7 counts ready boxes at four successive checks, C1 to C4. The unit is boxes ready at a check. Only those four checks are recorded; no values before or after them are supplied.
Describe the pattern actually visible in the recorded points. If there is no recorded rise or fall, do not invent one just to add an exception. No claim about future box counts or readiness in every club is supplied.
練習する
問われた語句・文を入力するか、選択肢を一つ選びます。英語の大文字・小文字、全角・半角、文末の記号は意味を保つ範囲で確認します。自分で書く長い説明や対話は、下の課題で講師と確かめます。
入力した答えは、ページを再読み込みするか離れるまで、このページのメモリ上に保持されます。保存済みの下書き、アカウントの成績、自動の宿題提出は作成されません。
自分の答えと記述
確認問題・資料・講師と使う課題
資料:四週間の貸出記録:全体と途中の低下
貸出数の四週間の全体と途中を保つ説明はどれですか。
- Loans rose each week, from 8 in W1 to 16 in W4.
- Loans rose overall from 8 to 16, but fell from 12 in W2 to 10 in W3.
- Loans were unchanged at all four recorded weeks.
答えと解説
Loans rose overall from 8 to 16, but fell from 12 in W2 to 10 in W3.
最初8から最後16へ増えていますが、途中のW2の12からW3の10へは低下しています。
資料:四週間の貸出記録:全体と途中の低下
貸出のグラフを示して説明するとき、図だけで裏付けられるのはどれですか。
- The recorded loans fell between W2 and W3; the cause is not shown.
- The graph shows an overall rise, and the line between W2 and W3 records a steady fall in the number of distinct borrowers each day.
- The line proves the exact number of loans at every unrecorded moment.
答えと解説
The recorded loans fell between W2 and W3; the cause is not shown.
観測した二時点の低下は読めますが、原因・読書力・観測間の全ての値は分かりません。
資料:残った無地カード:全体の減少と増加した区間
残ったカードの全体の変化と途中の例外に合う説明はどれですか。
- The count fell from 20 after S1 to 12 after S4, with an upward interval from 16 after S3 to 18 after S4.
- The recorded count stayed at 20 after the first session and after each of the next three sessions.
- The count fell overall from 20 to 12, but rose from 16 in S2 to 18 in S3.
答えと解説
The count fell overall from 20 to 12, but rose from 16 in S2 to 18 in S3.
全体は20から12への減少ですが、S2からS3では16から18へ増加しています。
資料:残った無地カード:全体の減少と増加した区間
残りのカードの増えた区間を、根拠の範囲で示す文はどれですか。
- Unused cards rose from 16 to 18 between S2 and S3; the reason is not supplied.
- Unused cards rose after S3 because fewer people used them.
- The graph proves that no cards were used in any session.
答えと解説
Unused cards rose from 16 to 18 between S2 and S3; the reason is not supplied.
増加区間と数値は示せますが、気持ちや実際に使った枚数をこの残数だけから断定しません。
資料:五日間の来訪:横ばいと最後の低下
五日間の来訪数について、グラフに合う説明はどれですか。
- Visits rose from 6 on Monday to 11 on Friday; the count fell from Tuesday to Wednesday and then increased from Thursday to Friday.
- Visits rose overall from 6 to 11, but Tuesday and Wednesday both had 9, and Friday was below Thursday.
- All five days recorded the same visit count, so the graph shows neither an increase nor a decrease from Monday to Friday.
答えと解説
Visits rose overall from 6 to 11, but Tuesday and Wednesday both had 9, and Friday was below Thursday.
月曜6から金曜11へ全体は増えています。火曜と水曜は9で同じで、木曜12から金曜11へは低下しています。
資料:五日間の来訪:横ばいと最後の低下
来訪数の図から、人数や人気を作らずに言えることはどれですか。
- Eleven visits on Friday proves there were exactly eleven different visitors.
- Tuesday and Wednesday each had nine visits from the same nine people.
- Tuesday and Wednesday recorded the same number of visits; distinct visitor counts are not shown.
答えと解説
Tuesday and Wednesday recorded the same number of visits; distinct visitor counts are not shown.
来訪の回数と、別々の人の数や人気は別です。この図では火曜と水曜の来訪数が同じと分かります。
資料:配置にかかった時間:増加と途中の横ばい
配置に使った時間の全体と横ばいを正しく示すのはどれですか。
- Time rose overall from 5 to 15 minutes, with 10 minutes at both S2 and S3.
- Time increased strictly at every step, including S2 to S3.
- Time rose from 5 minutes at S1 to 15 minutes at S4, with an unchanged count of 5 minutes at both S1 and S2.
答えと解説
Time rose overall from 5 to 15 minutes, with 10 minutes at both S2 and S3.
最初5分から最後15分へ増えていますが、S2とS3はどちらも10分です。
資料:配置にかかった時間:増加と途中の横ばい
配置時間のグラフを口頭で説明するとき、図から言える範囲はどれですか。
- The graph shows that the recorded time stayed at 10 minutes from S2 to S3 because the team arranged the same number of items in both sessions.
- The recorded time was unchanged between S2 and S3; work quality and causes are not supplied.
- The graph proves that the same number of items was arranged at each session.
答えと解説
The recorded time was unchanged between S2 and S3; work quality and causes are not supplied.
S2とS3の時間は同じですが、作業の量・質・時間差の原因は示されていません。
資料:完成したカード:最後の値と最大値を分ける
完成したカードの最初・最後と最大値を保つ説明はどれですか。
- The last count was the largest, and the count rose at every step.
- The count rose from 3 to 7 overall and peaked at 8 in S3.
- The count rose overall from 3 to 7, but peaked at 8 in S2, before the last session.
答えと解説
The count rose overall from 3 to 7, but peaked at 8 in S2, before the last session.
最初3から最後7へ増えていますが、最大は途中のS2の8です。S2からS3へは8から6に低下しています。
資料:完成したカード:最後の値と最大値を分ける
完成数のグラフで、最大の箇所を正しく示す文はどれですか。
- S2 had the highest recorded count, 8 cards; S4 had 7.
- S4 had the highest recorded count, with 7 cards, and S2 had the next highest count of 6.
- S2 proves every member's skill improved permanently.
答えと解説
S2 had the highest recorded count, 8 cards; S4 had 7.
最大値はS2の8枚で、最後のS4の7枚と区別します。技能や原因はこの図から断定しません。
資料:トレーの用紙:同じ両端と途中の動き
用紙数の同じ両端と途中の変化を保つ説明はどれですか。
- The first and last counts were both 14, with a rise to 16 at C2 followed by a fall through 12 back to 14.
- The first and last counts were both 14, but the count fell to 10 and then rose through 12 to 14.
- The count fell strictly at every step, ending below 10.
答えと解説
The first and last counts were both 14, but the count fell to 10 and then rose through 12 to 14.
両端は14で同じですが、途中は10へ低下し、12、14と上がっています。全期間一定ではありません。
資料:トレーの用紙:同じ両端と途中の動き
トレーの図の両端が同じことについて、説明の範囲に合う文はどれですか。
- Equal endpoints prove that no sheets entered or left the tray at any moment.
- The first and last counts agree, so the differences in the middle can be ignored when describing the tray as having 14 sheets at each check.
- The endpoints match, but the intervening recorded counts differ; unrecorded values and causes are unknown.
答えと解説
The endpoints match, but the intervening recorded counts differ; unrecorded values and causes are unknown.
同じ両端と、途中に記録された違いを両方保ちます。未観測の時点の数や出入りの原因は示されていません。
資料:四回とも同じ値:例外を作らない
準備できた箱の四回の記録に合う説明はどれですか。
- The count was 10 at all four recorded checks, with no recorded rise or fall.
- The count was 10 at the first and last checks, but it increased to 12 in the middle and then dropped back to the starting level.
- The count increased at every step from C1 to C4.
答えと解説
The count was 10 at all four recorded checks, with no recorded rise or fall.
四回とも10で、各観測点の値は同じです。記録された値の増減はなく、未観測の値や図にない例外は作りません。
資料:四回とも同じ値:例外を作らない
箱の図を示す発表で、例外や将来について正しく扱う文はどれですか。
- A fall should be added to the chart because a report needs an exception, even when every recorded count is equal.
- No exception is visible among these four equal counts; future counts are not shown.
- The count stayed at 10 across four recorded checks, which is enough to predict that the next check will also show 10 ready boxes.
答えと解説
No exception is visible among these four equal counts; future counts are not shown.
この四点では例外を加えず同じ値と説明します。未提示の未来や他のクラブへ一般化しません。
記述・対話・実習を講師と確かめる
資料:四週間の貸出記録:全体と途中の低下
資料「四週間の貸出記録:全体と途中の低下」のグラフを使います。架空のクラブの四週間W1〜W4の貸出回数で、単位はloansです。値は順に8、12、10、16です。人数の記録ではありません。クラブの人へ、全体の変化と、途中でその単純な動きに合わない区間を図に対応させて話します。変化の理由や読書力は示されていません。 講師は解答例を生徒に見せずに聞き手になります。生徒は指定のグラフを聞き手にも示し、箇所を指したり言葉で特定したりしながら、図の対象・時点や期間・単位と、全体の動き・途中の特徴を英語でまとまりよく説明します。語句表・キーワードのメモ・言い直し・支援を使えます。全点の読み上げ、同じ接続詞・語数・秒数・視線・スライド作成・録音や質問応答・役交代は必須ではありません。実際に調査する必要はありません。
答えと解説
模擬発表例:This graph shows book loans at our fictional club corner in weeks one to four. The numbers are loan transactions. Loans rose overall from 8 to 16. However, they fell from 12 in week two to 10 in week three. The graph does not show why. 貸出回数と別々の人の数を混同しない。W2からW3への低下を保ち、全点を必ず読むことや最後の不明点の一文だけを条件にしない。
- 四週間の貸出回数であると示し、最初8から最後16への増加と、W2の12からW3の10への低下を区別して伝える。
- 指定の図を聞き手と共有し、対象・時点と単位を示して、図に対応する根拠で英語の説明をする。
- 未提示の原因・人気・効果・未観測の値や将来の結果へ広げない。
資料:残った無地カード:全体の減少と増加した区間
資料「残った無地カード:全体の減少と増加した区間」のグラフを使います。架空のクラブで四回の活動S1〜S4の後に残った無地カードの枚数で、単位はcardsです。値は順に20、16、18、12です。残った理由や活動の成功は示されていません。クラブの人へ、最初と最後の変化と、途中で増えた区間が分かるように図を示して説明します。 講師は解答例を生徒に見せずに聞き手になります。生徒は指定のグラフを聞き手にも示し、箇所を指したり言葉で特定したりしながら、図の対象・時点や期間・単位と、全体の動き・途中の特徴を英語でまとまりよく説明します。語句表・キーワードのメモ・言い直し・支援を使えます。全点の読み上げ、同じ接続詞・語数・秒数・視線・スライド作成・録音や質問応答・役交代は必須ではありません。実際に調査する必要はありません。
答えと解説
模擬発表例:This graph shows unused blank cards after four club sessions, from S1 to S4. The unit is cards. The count fell overall from 20 to 12, but it rose from 16 after S2 to 18 after S3. The reason for that rise is not supplied. 減少の途中の増加を、S2〜S3と数値で示すなどして図に対応させる。残数から使用済み枚数・気持ち・成功を作らない。
- 活動後のカード残数という対象を示し、全体の20から12への減少と、S2〜S3の16から18への増加を区別する。
- 指定の図を聞き手と共有し、対象・時点と単位を示して、図に対応する根拠で英語の説明をする。
- 未提示の原因・人気・効果・未観測の値や将来の結果へ広げない。
資料:五日間の来訪:横ばいと最後の低下
資料「五日間の来訪:横ばいと最後の低下」のグラフを使います。架空のクラブの月曜〜金曜の来訪回数で、単位はvisitsです。値は月曜6、火曜9、水曜9、木曜12、金曜11です。別々の人の数や人気の記録ではありません。クラブの人へ、最初と最後の全体の動きと、途中で毎日増えたわけではないことが分かる箇所を図で示して話します。途中の特徴を全て列挙することは必須ではありません。 講師は解答例を生徒に見せずに聞き手になります。生徒は指定のグラフを聞き手にも示し、箇所を指したり言葉で特定したりしながら、図の対象・時点や期間・単位と、全体の動き・途中の特徴を英語でまとまりよく説明します。語句表・キーワードのメモ・言い直し・支援を使えます。全点の読み上げ、同じ接続詞・語数・秒数・視線・スライド作成・録音や質問応答・役交代は必須ではありません。実際に調査する必要はありません。
答えと解説
模擬発表例:This graph shows visits to our fictional club corner from Monday to Friday. The unit is visits, not distinct visitors. Visits rose overall from 6 to 11. However, Tuesday and Wednesday both had 9 visits. There was also a fall from 12 on Thursday to 11 on Friday. 横ばいか最後の低下など、毎日増加ではないと分かる箇所を正しく示せば、全ての特徴の列挙は不要。人数・人気・原因へ広げない。
- 来訪回数の全体の増加と、火曜〜水曜の横ばい又は木曜〜金曜の低下などの根拠を区別して伝える。
- 指定の図を聞き手と共有し、対象・時点と単位を示して、図に対応する根拠で英語の説明をする。
- 未提示の原因・人気・効果・未観測の値や将来の結果へ広げない。
資料:配置にかかった時間:増加と途中の横ばい
資料「配置にかかった時間:増加と途中の横ばい」のグラフを使います。架空のクラブの四回の活動S1〜S4で、展示物の配置に使った時間です。単位はminutesで、値は順に5、10、10、15です。作業の量・質や時間差の原因は示されていません。クラブの人へ、全体の変化と途中の横ばいを図で示して話します。 講師は解答例を生徒に見せずに聞き手になります。生徒は指定のグラフを聞き手にも示し、箇所を指したり言葉で特定したりしながら、図の対象・時点や期間・単位と、全体の動き・途中の特徴を英語でまとまりよく説明します。語句表・キーワードのメモ・言い直し・支援を使えます。全点の読み上げ、同じ接続詞・語数・秒数・視線・スライド作成・録音や質問応答・役交代は必須ではありません。実際に調査する必要はありません。
答えと解説
模擬発表例:This graph shows minutes spent arranging a display in four club sessions, from S1 to S4. Time rose overall from 5 to 15 minutes. However, it stayed at 10 minutes in both S2 and S3. The graph does not tell us about work quality or why the times differed. 時間が長いことを、量や質・効率の改善の証拠にしない。対象・時点・単位と、増加・横ばいの関係を自然な別表現で伝えてよい。
- 配置時間という対象と分の単位を示し、5から15への全体の増加とS2〜S3の10分での横ばいを区別する。
- 指定の図を聞き手と共有し、対象・時点と単位を示して、図に対応する根拠で英語の説明をする。
- 未提示の原因・人気・効果・未観測の値や将来の結果へ広げない。
資料:完成したカード:最後の値と最大値を分ける
資料「完成したカード:最後の値と最大値を分ける」のグラフを使います。架空のクラブの四回の活動S1〜S4で、その回に完成した絵カードの枚数です。単位はcardsで、値は順に3、8、6、7です。全回の累積枚数ではありません。原因・カードの質・技能の変化は示されていません。クラブの人へ、最初と最後の変化と、最大だった回が最後ではないことを図で示して話します。 講師は解答例を生徒に見せずに聞き手になります。生徒は指定のグラフを聞き手にも示し、箇所を指したり言葉で特定したりしながら、図の対象・時点や期間・単位と、全体の動き・途中の特徴を英語でまとまりよく説明します。語句表・キーワードのメモ・言い直し・支援を使えます。全点の読み上げ、同じ接続詞・語数・秒数・視線・スライド作成・録音や質問応答・役交代は必須ではありません。実際に調査する必要はありません。
答えと解説
模擬発表例:This graph shows picture cards completed in each of four club sessions, from S1 to S4. The unit is cards. The count rose overall from 3 to 7. However, the highest recorded count was 8 in S2, not in the last session. S4 had 7 cards. 最大値8と最後の7を区別する。途中の低下も説明できるが、全点の列挙を条件にしない。累積数・技能・原因は作らない。
- 各回の完成枚数という対象を示し、最初3・最後7の増加と、S2の最大8が最後の値ではないことを伝える。
- 指定の図を聞き手と共有し、対象・時点と単位を示して、図に対応する根拠で英語の説明をする。
- 未提示の原因・人気・効果・未観測の値や将来の結果へ広げない。
資料:四回とも同じ値:例外を作らない
資料「四回とも同じ値:例外を作らない」のグラフを使います。架空のクラブで四回の確認C1〜C4のときに準備できていた箱の数です。単位はboxesで、四回とも10です。この観測以外の時点や未来の数は示されていません。クラブの人へ、図に実際に見える動きを説明します。例外が見えなければ、増加や低下を無理に作りません。 講師は解答例を生徒に見せずに聞き手になります。生徒は指定のグラフを聞き手にも示し、箇所を指したり言葉で特定したりしながら、図の対象・時点や期間・単位と、全体の動き・途中の特徴を英語でまとまりよく説明します。語句表・キーワードのメモ・言い直し・支援を使えます。全点の読み上げ、同じ接続詞・語数・秒数・視線・スライド作成・録音や質問応答・役交代は必須ではありません。実際に調査する必要はありません。
答えと解説
模擬発表例:This graph shows ready boxes at four checks, from C1 to C4. The unit is boxes. The count was 10 at each recorded check. There was no recorded rise or fall among these four values. We do not have counts outside these checks. この四つの観測値が同じだと伝える。途中の未観測の値も未来も必ず10とせず、例外を作ることを条件にしない。
- 四回の箱の記録で全て10と図に対応させて示し、記録にない例外や未来の値を作らず説明する。
- 指定の図を聞き手と共有し、対象・時点と単位を示して、図に対応する根拠で英語の説明をする。
- 未提示の原因・人気・効果・未観測の値や将来の結果へ広げない。
ワークシート
学習内容と参考資料
日本の学習指導要領
文部科学省の高校外国語編の冊子50〜51(PDF60〜61)の、語句・構成の支援や図表を用い、根拠とともに聞き手へ話して伝える活動の一部を土台にした独自教材です。British Councilの図の対象・全体像・重要な変化を整理する助言も参考にしていますが、同資料は書く活動です。ここでは実際の口頭説明を講師が観察し、高校科目全体・試験・CEFRの到達を認定しません。 · 2026-11-07
学習内容と参考資料文部科学省 · 語句・メモ・構成や図表の支援、根拠とともに伝える発表の一部。
British Council・文法資料 · 書く活動の助言から、図の対象・全体像・重要な変化の整理を参考にします。試験の語数・時間や元の統計は使いません。
授業・宿題・次の記録につなげる
短い確認の後は、記述・対話・実習の課題を講師と振り返ります。伝わった点や本文の根拠、次に直す点を分け、助言の後に別の文や場面でも確かめましょう。印刷や宿題に使う範囲を講師が選びます。年少の生徒には講師が紙の教材を用意します。生徒用のログインを使う場合は、利用条件と同意の手順を確認してください。
講師の方へ
教材にリンクを保存し、必要なときに生徒と共有できます。
この練習問題を保存ワークシート: グラフを示して傾向と例外を口頭で説明する
MomentDesk · https://momentdesk.com/ja/practice/explain-graph-trends-and-exceptions-in-a-short-presentation/
講師が、生徒が指定のグラフを聞き手と共有し、図の対象・期間や観測時点・単位を英語で示し、必要な数値や位置を根拠に全体の動きと途中の特徴をまとまりよく説明することを観察します。低下・横ばい・最大値など、全体の単純化を防ぐ特徴があれば伝え、観測値が全て同じなら例外を作らずその範囲を説明します。図にない原因・人気・効果・将来の変化は加えません。全点の読み上げ・同じ接続詞・語数・秒数・視線・録音を必須にせず、語句・メモ・言い直し・支援と自然な別表現を認めて記録します。図の読み取りや選択・筆記・例の全文暗唱だけを実際の口頭説明の達成とはせず、自動採点しません。
文部科学省の高校外国語編 · British Council: Describing charts
読む文章・資料
四週間の貸出記録:全体と途中の低下
Fictional graph 1 records the number of book loans in each of four weeks, W1 to W4, at a club corner. The unit is loan transactions, not unique people. The labelled points are joined to help show their order.
Use the recorded points to explain the overall change and any interval that differs from a simple upward pattern. No reason for the changes, reading ability, or value between the recorded points is supplied.
残った無地カード:全体の減少と増加した区間
Fictional graph 2 shows unused blank cards counted after four club sessions, S1 to S4. The unit is cards. Each point is the count after that session; it is not a count of people.
Explain the change from the first count to the last and check the intervening counts. No explanation of why cards remained, how they were used, or whether the activity was successful is supplied.
五日間の来訪:横ばいと最後の低下
Fictional graph 3 counts visits to a club corner from Monday to Friday. The unit is visits, not distinct visitors. A person could make more than one visit; the graph gives no individual records.
Explain the overall direction using the first and last days, and check whether every daily step increases. No popularity measure, reason for visiting, or later-week prediction is supplied.
配置にかかった時間:増加と途中の横ばい
Fictional graph 4 records minutes spent arranging a display in four sessions, S1 to S4. It describes recorded time spent on this job, not a speed score or a measure of how good the display was.
Explain the first-to-last change and an interval with no change. The graph does not supply the cause of the time differences, the quality of the work, or the amount of work completed.
完成したカード:最後の値と最大値を分ける
Fictional graph 5 counts picture cards completed in each of four club sessions, S1 to S4. The unit is cards completed in that session, not a cumulative total across sessions.
Explain the first-to-last change and locate the largest recorded count. No cause, card quality, member ability, or prediction about the next session is supplied.
トレーの用紙:同じ両端と途中の動き
Fictional graph 6 counts sheets left in a tray at four successive checks, C1 to C4. The unit is sheets at a check. The time between checks and the reasons for the changes are not supplied.
Explain both the first and last recorded counts and the pattern in between. Equal first and last values do not by themselves mean that all recorded values are equal.
四回とも同じ値:例外を作らない
Fictional graph 7 counts ready boxes at four successive checks, C1 to C4. The unit is boxes ready at a check. Only those four checks are recorded; no values before or after them are supplied.
Describe the pattern actually visible in the recorded points. If there is no recorded rise or fall, do not invent one just to add an exception. No claim about future box counts or readiness in every club is supplied.
資料:四週間の貸出記録:全体と途中の低下
貸出数の四週間の全体と途中を保つ説明はどれですか。
- Loans rose each week, from 8 in W1 to 16 in W4.
- Loans rose overall from 8 to 16, but fell from 12 in W2 to 10 in W3.
- Loans were unchanged at all four recorded weeks.
根拠・考え方・伝えたい内容・見直し答え:
資料:四週間の貸出記録:全体と途中の低下
貸出のグラフを示して説明するとき、図だけで裏付けられるのはどれですか。
- The recorded loans fell between W2 and W3; the cause is not shown.
- The graph shows an overall rise, and the line between W2 and W3 records a steady fall in the number of distinct borrowers each day.
- The line proves the exact number of loans at every unrecorded moment.
根拠・考え方・伝えたい内容・見直し答え:
資料:残った無地カード:全体の減少と増加した区間
残ったカードの全体の変化と途中の例外に合う説明はどれですか。
- The count fell from 20 after S1 to 12 after S4, with an upward interval from 16 after S3 to 18 after S4.
- The recorded count stayed at 20 after the first session and after each of the next three sessions.
- The count fell overall from 20 to 12, but rose from 16 in S2 to 18 in S3.
根拠・考え方・伝えたい内容・見直し答え:
資料:残った無地カード:全体の減少と増加した区間
残りのカードの増えた区間を、根拠の範囲で示す文はどれですか。
- Unused cards rose from 16 to 18 between S2 and S3; the reason is not supplied.
- Unused cards rose after S3 because fewer people used them.
- The graph proves that no cards were used in any session.
根拠・考え方・伝えたい内容・見直し答え:
資料:五日間の来訪:横ばいと最後の低下
五日間の来訪数について、グラフに合う説明はどれですか。
- Visits rose from 6 on Monday to 11 on Friday; the count fell from Tuesday to Wednesday and then increased from Thursday to Friday.
- Visits rose overall from 6 to 11, but Tuesday and Wednesday both had 9, and Friday was below Thursday.
- All five days recorded the same visit count, so the graph shows neither an increase nor a decrease from Monday to Friday.
根拠・考え方・伝えたい内容・見直し答え:
資料:五日間の来訪:横ばいと最後の低下
来訪数の図から、人数や人気を作らずに言えることはどれですか。
- Eleven visits on Friday proves there were exactly eleven different visitors.
- Tuesday and Wednesday each had nine visits from the same nine people.
- Tuesday and Wednesday recorded the same number of visits; distinct visitor counts are not shown.
根拠・考え方・伝えたい内容・見直し答え:
資料:配置にかかった時間:増加と途中の横ばい
配置に使った時間の全体と横ばいを正しく示すのはどれですか。
- Time rose overall from 5 to 15 minutes, with 10 minutes at both S2 and S3.
- Time increased strictly at every step, including S2 to S3.
- Time rose from 5 minutes at S1 to 15 minutes at S4, with an unchanged count of 5 minutes at both S1 and S2.
根拠・考え方・伝えたい内容・見直し答え:
資料:配置にかかった時間:増加と途中の横ばい
配置時間のグラフを口頭で説明するとき、図から言える範囲はどれですか。
- The graph shows that the recorded time stayed at 10 minutes from S2 to S3 because the team arranged the same number of items in both sessions.
- The recorded time was unchanged between S2 and S3; work quality and causes are not supplied.
- The graph proves that the same number of items was arranged at each session.
根拠・考え方・伝えたい内容・見直し答え:
資料:完成したカード:最後の値と最大値を分ける
完成したカードの最初・最後と最大値を保つ説明はどれですか。
- The last count was the largest, and the count rose at every step.
- The count rose from 3 to 7 overall and peaked at 8 in S3.
- The count rose overall from 3 to 7, but peaked at 8 in S2, before the last session.
根拠・考え方・伝えたい内容・見直し答え:
資料:完成したカード:最後の値と最大値を分ける
完成数のグラフで、最大の箇所を正しく示す文はどれですか。
- S2 had the highest recorded count, 8 cards; S4 had 7.
- S4 had the highest recorded count, with 7 cards, and S2 had the next highest count of 6.
- S2 proves every member's skill improved permanently.
根拠・考え方・伝えたい内容・見直し答え:
資料:トレーの用紙:同じ両端と途中の動き
用紙数の同じ両端と途中の変化を保つ説明はどれですか。
- The first and last counts were both 14, with a rise to 16 at C2 followed by a fall through 12 back to 14.
- The first and last counts were both 14, but the count fell to 10 and then rose through 12 to 14.
- The count fell strictly at every step, ending below 10.
根拠・考え方・伝えたい内容・見直し答え:
資料:トレーの用紙:同じ両端と途中の動き
トレーの図の両端が同じことについて、説明の範囲に合う文はどれですか。
- Equal endpoints prove that no sheets entered or left the tray at any moment.
- The first and last counts agree, so the differences in the middle can be ignored when describing the tray as having 14 sheets at each check.
- The endpoints match, but the intervening recorded counts differ; unrecorded values and causes are unknown.
根拠・考え方・伝えたい内容・見直し答え:
資料:四回とも同じ値:例外を作らない
準備できた箱の四回の記録に合う説明はどれですか。
- The count was 10 at all four recorded checks, with no recorded rise or fall.
- The count was 10 at the first and last checks, but it increased to 12 in the middle and then dropped back to the starting level.
- The count increased at every step from C1 to C4.
根拠・考え方・伝えたい内容・見直し答え:
資料:四回とも同じ値:例外を作らない
箱の図を示す発表で、例外や将来について正しく扱う文はどれですか。
- A fall should be added to the chart because a report needs an exception, even when every recorded count is equal.
- No exception is visible among these four equal counts; future counts are not shown.
- The count stayed at 10 across four recorded checks, which is enough to predict that the next check will also show 10 ready boxes.
根拠・考え方・伝えたい内容・見直し答え:
記述・対話・実習を講師と確かめる
ここからは講師と確認する記述問題です。自動採点の点数には含みません。
資料:四週間の貸出記録:全体と途中の低下
資料「四週間の貸出記録:全体と途中の低下」のグラフを使います。架空のクラブの四週間W1〜W4の貸出回数で、単位はloansです。値は順に8、12、10、16です。人数の記録ではありません。クラブの人へ、全体の変化と、途中でその単純な動きに合わない区間を図に対応させて話します。変化の理由や読書力は示されていません。 講師は解答例を生徒に見せずに聞き手になります。生徒は指定のグラフを聞き手にも示し、箇所を指したり言葉で特定したりしながら、図の対象・時点や期間・単位と、全体の動き・途中の特徴を英語でまとまりよく説明します。語句表・キーワードのメモ・言い直し・支援を使えます。全点の読み上げ、同じ接続詞・語数・秒数・視線・スライド作成・録音や質問応答・役交代は必須ではありません。実際に調査する必要はありません。
資料:残った無地カード:全体の減少と増加した区間
資料「残った無地カード:全体の減少と増加した区間」のグラフを使います。架空のクラブで四回の活動S1〜S4の後に残った無地カードの枚数で、単位はcardsです。値は順に20、16、18、12です。残った理由や活動の成功は示されていません。クラブの人へ、最初と最後の変化と、途中で増えた区間が分かるように図を示して説明します。 講師は解答例を生徒に見せずに聞き手になります。生徒は指定のグラフを聞き手にも示し、箇所を指したり言葉で特定したりしながら、図の対象・時点や期間・単位と、全体の動き・途中の特徴を英語でまとまりよく説明します。語句表・キーワードのメモ・言い直し・支援を使えます。全点の読み上げ、同じ接続詞・語数・秒数・視線・スライド作成・録音や質問応答・役交代は必須ではありません。実際に調査する必要はありません。
資料:五日間の来訪:横ばいと最後の低下
資料「五日間の来訪:横ばいと最後の低下」のグラフを使います。架空のクラブの月曜〜金曜の来訪回数で、単位はvisitsです。値は月曜6、火曜9、水曜9、木曜12、金曜11です。別々の人の数や人気の記録ではありません。クラブの人へ、最初と最後の全体の動きと、途中で毎日増えたわけではないことが分かる箇所を図で示して話します。途中の特徴を全て列挙することは必須ではありません。 講師は解答例を生徒に見せずに聞き手になります。生徒は指定のグラフを聞き手にも示し、箇所を指したり言葉で特定したりしながら、図の対象・時点や期間・単位と、全体の動き・途中の特徴を英語でまとまりよく説明します。語句表・キーワードのメモ・言い直し・支援を使えます。全点の読み上げ、同じ接続詞・語数・秒数・視線・スライド作成・録音や質問応答・役交代は必須ではありません。実際に調査する必要はありません。
資料:配置にかかった時間:増加と途中の横ばい
資料「配置にかかった時間:増加と途中の横ばい」のグラフを使います。架空のクラブの四回の活動S1〜S4で、展示物の配置に使った時間です。単位はminutesで、値は順に5、10、10、15です。作業の量・質や時間差の原因は示されていません。クラブの人へ、全体の変化と途中の横ばいを図で示して話します。 講師は解答例を生徒に見せずに聞き手になります。生徒は指定のグラフを聞き手にも示し、箇所を指したり言葉で特定したりしながら、図の対象・時点や期間・単位と、全体の動き・途中の特徴を英語でまとまりよく説明します。語句表・キーワードのメモ・言い直し・支援を使えます。全点の読み上げ、同じ接続詞・語数・秒数・視線・スライド作成・録音や質問応答・役交代は必須ではありません。実際に調査する必要はありません。
資料:完成したカード:最後の値と最大値を分ける
資料「完成したカード:最後の値と最大値を分ける」のグラフを使います。架空のクラブの四回の活動S1〜S4で、その回に完成した絵カードの枚数です。単位はcardsで、値は順に3、8、6、7です。全回の累積枚数ではありません。原因・カードの質・技能の変化は示されていません。クラブの人へ、最初と最後の変化と、最大だった回が最後ではないことを図で示して話します。 講師は解答例を生徒に見せずに聞き手になります。生徒は指定のグラフを聞き手にも示し、箇所を指したり言葉で特定したりしながら、図の対象・時点や期間・単位と、全体の動き・途中の特徴を英語でまとまりよく説明します。語句表・キーワードのメモ・言い直し・支援を使えます。全点の読み上げ、同じ接続詞・語数・秒数・視線・スライド作成・録音や質問応答・役交代は必須ではありません。実際に調査する必要はありません。
資料:四回とも同じ値:例外を作らない
資料「四回とも同じ値:例外を作らない」のグラフを使います。架空のクラブで四回の確認C1〜C4のときに準備できていた箱の数です。単位はboxesで、四回とも10です。この観測以外の時点や未来の数は示されていません。クラブの人へ、図に実際に見える動きを説明します。例外が見えなければ、増加や低下を無理に作りません。 講師は解答例を生徒に見せずに聞き手になります。生徒は指定のグラフを聞き手にも示し、箇所を指したり言葉で特定したりしながら、図の対象・時点や期間・単位と、全体の動き・途中の特徴を英語でまとまりよく説明します。語句表・キーワードのメモ・言い直し・支援を使えます。全点の読み上げ、同じ接続詞・語数・秒数・視線・スライド作成・録音や質問応答・役交代は必須ではありません。実際に調査する必要はありません。
解答: グラフを示して傾向と例外を口頭で説明する
Loans rose overall from 8 to 16, but fell from 12 in W2 to 10 in W3.
最初8から最後16へ増えていますが、途中のW2の12からW3の10へは低下しています。
The recorded loans fell between W2 and W3; the cause is not shown.
観測した二時点の低下は読めますが、原因・読書力・観測間の全ての値は分かりません。
The count fell overall from 20 to 12, but rose from 16 in S2 to 18 in S3.
全体は20から12への減少ですが、S2からS3では16から18へ増加しています。
Unused cards rose from 16 to 18 between S2 and S3; the reason is not supplied.
増加区間と数値は示せますが、気持ちや実際に使った枚数をこの残数だけから断定しません。
Visits rose overall from 6 to 11, but Tuesday and Wednesday both had 9, and Friday was below Thursday.
月曜6から金曜11へ全体は増えています。火曜と水曜は9で同じで、木曜12から金曜11へは低下しています。
Tuesday and Wednesday recorded the same number of visits; distinct visitor counts are not shown.
来訪の回数と、別々の人の数や人気は別です。この図では火曜と水曜の来訪数が同じと分かります。
Time rose overall from 5 to 15 minutes, with 10 minutes at both S2 and S3.
最初5分から最後15分へ増えていますが、S2とS3はどちらも10分です。
The recorded time was unchanged between S2 and S3; work quality and causes are not supplied.
S2とS3の時間は同じですが、作業の量・質・時間差の原因は示されていません。
The count rose overall from 3 to 7, but peaked at 8 in S2, before the last session.
最初3から最後7へ増えていますが、最大は途中のS2の8です。S2からS3へは8から6に低下しています。
S2 had the highest recorded count, 8 cards; S4 had 7.
最大値はS2の8枚で、最後のS4の7枚と区別します。技能や原因はこの図から断定しません。
The first and last counts were both 14, but the count fell to 10 and then rose through 12 to 14.
両端は14で同じですが、途中は10へ低下し、12、14と上がっています。全期間一定ではありません。
The endpoints match, but the intervening recorded counts differ; unrecorded values and causes are unknown.
同じ両端と、途中に記録された違いを両方保ちます。未観測の時点の数や出入りの原因は示されていません。
The count was 10 at all four recorded checks, with no recorded rise or fall.
四回とも10で、各観測点の値は同じです。記録された値の増減はなく、未観測の値や図にない例外は作りません。
No exception is visible among these four equal counts; future counts are not shown.
この四点では例外を加えず同じ値と説明します。未提示の未来や他のクラブへ一般化しません。
記述問題の解答・確認の観点
資料:四週間の貸出記録:全体と途中の低下
資料「四週間の貸出記録:全体と途中の低下」のグラフを使います。架空のクラブの四週間W1〜W4の貸出回数で、単位はloansです。値は順に8、12、10、16です。人数の記録ではありません。クラブの人へ、全体の変化と、途中でその単純な動きに合わない区間を図に対応させて話します。変化の理由や読書力は示されていません。 講師は解答例を生徒に見せずに聞き手になります。生徒は指定のグラフを聞き手にも示し、箇所を指したり言葉で特定したりしながら、図の対象・時点や期間・単位と、全体の動き・途中の特徴を英語でまとまりよく説明します。語句表・キーワードのメモ・言い直し・支援を使えます。全点の読み上げ、同じ接続詞・語数・秒数・視線・スライド作成・録音や質問応答・役交代は必須ではありません。実際に調査する必要はありません。
模擬発表例:This graph shows book loans at our fictional club corner in weeks one to four. The numbers are loan transactions. Loans rose overall from 8 to 16. However, they fell from 12 in week two to 10 in week three. The graph does not show why. 貸出回数と別々の人の数を混同しない。W2からW3への低下を保ち、全点を必ず読むことや最後の不明点の一文だけを条件にしない。
- 四週間の貸出回数であると示し、最初8から最後16への増加と、W2の12からW3の10への低下を区別して伝える。
- 指定の図を聞き手と共有し、対象・時点と単位を示して、図に対応する根拠で英語の説明をする。
- 未提示の原因・人気・効果・未観測の値や将来の結果へ広げない。
資料:残った無地カード:全体の減少と増加した区間
資料「残った無地カード:全体の減少と増加した区間」のグラフを使います。架空のクラブで四回の活動S1〜S4の後に残った無地カードの枚数で、単位はcardsです。値は順に20、16、18、12です。残った理由や活動の成功は示されていません。クラブの人へ、最初と最後の変化と、途中で増えた区間が分かるように図を示して説明します。 講師は解答例を生徒に見せずに聞き手になります。生徒は指定のグラフを聞き手にも示し、箇所を指したり言葉で特定したりしながら、図の対象・時点や期間・単位と、全体の動き・途中の特徴を英語でまとまりよく説明します。語句表・キーワードのメモ・言い直し・支援を使えます。全点の読み上げ、同じ接続詞・語数・秒数・視線・スライド作成・録音や質問応答・役交代は必須ではありません。実際に調査する必要はありません。
模擬発表例:This graph shows unused blank cards after four club sessions, from S1 to S4. The unit is cards. The count fell overall from 20 to 12, but it rose from 16 after S2 to 18 after S3. The reason for that rise is not supplied. 減少の途中の増加を、S2〜S3と数値で示すなどして図に対応させる。残数から使用済み枚数・気持ち・成功を作らない。
- 活動後のカード残数という対象を示し、全体の20から12への減少と、S2〜S3の16から18への増加を区別する。
- 指定の図を聞き手と共有し、対象・時点と単位を示して、図に対応する根拠で英語の説明をする。
- 未提示の原因・人気・効果・未観測の値や将来の結果へ広げない。
資料:五日間の来訪:横ばいと最後の低下
資料「五日間の来訪:横ばいと最後の低下」のグラフを使います。架空のクラブの月曜〜金曜の来訪回数で、単位はvisitsです。値は月曜6、火曜9、水曜9、木曜12、金曜11です。別々の人の数や人気の記録ではありません。クラブの人へ、最初と最後の全体の動きと、途中で毎日増えたわけではないことが分かる箇所を図で示して話します。途中の特徴を全て列挙することは必須ではありません。 講師は解答例を生徒に見せずに聞き手になります。生徒は指定のグラフを聞き手にも示し、箇所を指したり言葉で特定したりしながら、図の対象・時点や期間・単位と、全体の動き・途中の特徴を英語でまとまりよく説明します。語句表・キーワードのメモ・言い直し・支援を使えます。全点の読み上げ、同じ接続詞・語数・秒数・視線・スライド作成・録音や質問応答・役交代は必須ではありません。実際に調査する必要はありません。
模擬発表例:This graph shows visits to our fictional club corner from Monday to Friday. The unit is visits, not distinct visitors. Visits rose overall from 6 to 11. However, Tuesday and Wednesday both had 9 visits. There was also a fall from 12 on Thursday to 11 on Friday. 横ばいか最後の低下など、毎日増加ではないと分かる箇所を正しく示せば、全ての特徴の列挙は不要。人数・人気・原因へ広げない。
- 来訪回数の全体の増加と、火曜〜水曜の横ばい又は木曜〜金曜の低下などの根拠を区別して伝える。
- 指定の図を聞き手と共有し、対象・時点と単位を示して、図に対応する根拠で英語の説明をする。
- 未提示の原因・人気・効果・未観測の値や将来の結果へ広げない。
資料:配置にかかった時間:増加と途中の横ばい
資料「配置にかかった時間:増加と途中の横ばい」のグラフを使います。架空のクラブの四回の活動S1〜S4で、展示物の配置に使った時間です。単位はminutesで、値は順に5、10、10、15です。作業の量・質や時間差の原因は示されていません。クラブの人へ、全体の変化と途中の横ばいを図で示して話します。 講師は解答例を生徒に見せずに聞き手になります。生徒は指定のグラフを聞き手にも示し、箇所を指したり言葉で特定したりしながら、図の対象・時点や期間・単位と、全体の動き・途中の特徴を英語でまとまりよく説明します。語句表・キーワードのメモ・言い直し・支援を使えます。全点の読み上げ、同じ接続詞・語数・秒数・視線・スライド作成・録音や質問応答・役交代は必須ではありません。実際に調査する必要はありません。
模擬発表例:This graph shows minutes spent arranging a display in four club sessions, from S1 to S4. Time rose overall from 5 to 15 minutes. However, it stayed at 10 minutes in both S2 and S3. The graph does not tell us about work quality or why the times differed. 時間が長いことを、量や質・効率の改善の証拠にしない。対象・時点・単位と、増加・横ばいの関係を自然な別表現で伝えてよい。
- 配置時間という対象と分の単位を示し、5から15への全体の増加とS2〜S3の10分での横ばいを区別する。
- 指定の図を聞き手と共有し、対象・時点と単位を示して、図に対応する根拠で英語の説明をする。
- 未提示の原因・人気・効果・未観測の値や将来の結果へ広げない。
資料:完成したカード:最後の値と最大値を分ける
資料「完成したカード:最後の値と最大値を分ける」のグラフを使います。架空のクラブの四回の活動S1〜S4で、その回に完成した絵カードの枚数です。単位はcardsで、値は順に3、8、6、7です。全回の累積枚数ではありません。原因・カードの質・技能の変化は示されていません。クラブの人へ、最初と最後の変化と、最大だった回が最後ではないことを図で示して話します。 講師は解答例を生徒に見せずに聞き手になります。生徒は指定のグラフを聞き手にも示し、箇所を指したり言葉で特定したりしながら、図の対象・時点や期間・単位と、全体の動き・途中の特徴を英語でまとまりよく説明します。語句表・キーワードのメモ・言い直し・支援を使えます。全点の読み上げ、同じ接続詞・語数・秒数・視線・スライド作成・録音や質問応答・役交代は必須ではありません。実際に調査する必要はありません。
模擬発表例:This graph shows picture cards completed in each of four club sessions, from S1 to S4. The unit is cards. The count rose overall from 3 to 7. However, the highest recorded count was 8 in S2, not in the last session. S4 had 7 cards. 最大値8と最後の7を区別する。途中の低下も説明できるが、全点の列挙を条件にしない。累積数・技能・原因は作らない。
- 各回の完成枚数という対象を示し、最初3・最後7の増加と、S2の最大8が最後の値ではないことを伝える。
- 指定の図を聞き手と共有し、対象・時点と単位を示して、図に対応する根拠で英語の説明をする。
- 未提示の原因・人気・効果・未観測の値や将来の結果へ広げない。
資料:四回とも同じ値:例外を作らない
資料「四回とも同じ値:例外を作らない」のグラフを使います。架空のクラブで四回の確認C1〜C4のときに準備できていた箱の数です。単位はboxesで、四回とも10です。この観測以外の時点や未来の数は示されていません。クラブの人へ、図に実際に見える動きを説明します。例外が見えなければ、増加や低下を無理に作りません。 講師は解答例を生徒に見せずに聞き手になります。生徒は指定のグラフを聞き手にも示し、箇所を指したり言葉で特定したりしながら、図の対象・時点や期間・単位と、全体の動き・途中の特徴を英語でまとまりよく説明します。語句表・キーワードのメモ・言い直し・支援を使えます。全点の読み上げ、同じ接続詞・語数・秒数・視線・スライド作成・録音や質問応答・役交代は必須ではありません。実際に調査する必要はありません。
模擬発表例:This graph shows ready boxes at four checks, from C1 to C4. The unit is boxes. The count was 10 at each recorded check. There was no recorded rise or fall among these four values. We do not have counts outside these checks. この四つの観測値が同じだと伝える。途中の未観測の値も未来も必ず10とせず、例外を作ることを条件にしない。
- 四回の箱の記録で全て10と図に対応させて示し、記録にない例外や未来の値を作らず説明する。
- 指定の図を聞き手と共有し、対象・時点と単位を示して、図に対応する根拠で英語の説明をする。
- 未提示の原因・人気・効果・未観測の値や将来の結果へ広げない。